

Miami passes LA as 2nd least affordable housing market in the U.S.
In this October installment of the RealtyHop Housing Affordability Index, we investigate the decision to purchase a home in the 100 most populous cities across America. Is homeownership affordable or even possible for the average family in each city? Every month we analyze proprietary RealtyHop data alongside comprehensive U.S. Census data to find out. See how your city fares in affordability.
The 5 Least Affordable Housing Markets
1. New York, NY
New York remained the least affordable housing market in the country for the fourth month in a row, despite home prices cooling off to $958,000. An average household in New York would need to spend 82.15% of their income on homeownership costs to own in the city.
2. Miami, FL
Miami overtook L.A. as the second most expensive housing market in the nation, even though the price decreased slightly since our last report. A household in Miami should expect to pay $2,653 per month toward homeownership costs, or roughly 81.55% of median incomes.
3. Los Angeles, CA
Los Angeles saw asking home prices fall to a median of $915,000 — down from $930,000 last month. The city’s homeownership burden was 81.18%, a decrease of 1.61% month over month.
4. Newark, NJ
Newark remained the fourth least affordable market this month. Prospective homeowners should expect to allocate, on average, 71.95% of their income toward mortgage and tax costs associated with buying.
5. Long Beach, CA
Long Beach was the fifth most cost-burdened market, led by expensive real estate relative to household income. A family in Long Beach should expect to pay 64.24% of income, or $3,373.32 per month, in order to own a home in the area.
![]() The 5 Most Affordable Housing Markets
The 5 Most Affordable Housing Markets
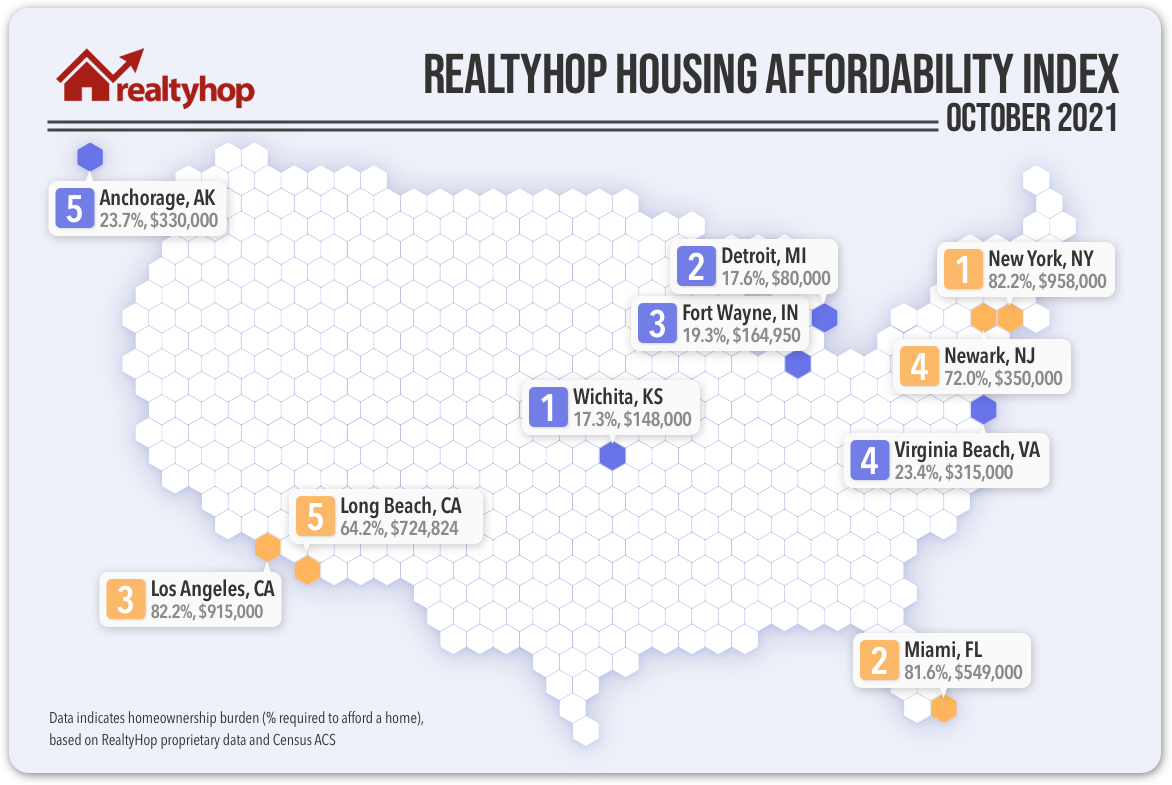
1. Wichita, KS
Real estate values dipped slightly over the past month in Wichita. For the first time since RealtyHop started tracking housing affordability in the U.S., it is now the most affordable city. A family making $52,620 can expect to set aside 17.34% of their annual income toward owning a home.
2. Detroit, MI
Home prices in Detroit have been on the rise in the past year. The median list price reached $80,000 in August, which pushed the city’s homeownership burden to 17.6%, or $453.22 per month.
3. Fort Wayne, IN
Fort Wayne remained the third most affordable city in the nation, with the median asking price decreasing slightly to $164,950. Buyers looking to purchase a home in Fort Wayne should factor in a total of $796.32 per month for mortgage repayments and property taxes.
4. Virginia Beach, VA
Virginia Beach ranked the fourth most affordable housing market, improving four spots in our affordability ranking. With a median list price of $315,000, a family looking to own will need to allocate 23.41% of their annual income toward homeownership costs.
5. Anchorage, AK
Anchorage concluded this month’s affordability index as the fifth most affordable city in the U.S. Median real estate values currently hover around $330,000. Based on a median household income of $84,928, a family in Anchorage should be prepared to set aside 23.74% of their annual income, or $1,680 a month, for mortgage and property tax payments.
Notable Changes This October
Cincinnati, OH
Cincinnati remained one of the hottest markets in the U.S., with homes selling faster than the national average. Sellers, however, have begun lowering their asking, which resulted in improved housing affordability. A family making median income can expect to set aside 32.97% of their annual income for homeownership costs.
Charlotte, NC
Charlotte has become increasingly unaffordable in the recent real estate boom. With the median asking price reaching over $379,000, it’s now the 45th least affordable housing market in the U.S. Families looking to buy in Charlotte should factor in $1,851 per month for costs associated with owning a home.
Methodology
The RealtyHop Housing Affordability Index analyzes both proprietary and ACS Census data to provide an index of housing affordability and homeownership burden across the 100 most populous cities in the country. Median home prices are calculated using over 300,000 listings in the RealtyHop database over the month prior to publication.
To calculate the index, the following statistics are used:
1) Median household income from the U.S. Census
2) Median for-sale home listing prices via RealtyHop data
3) Local property taxes via ACS Census data
4) Mortgage expenses, assuming a 30-year mortgage, 4.5% interest rate, and 20% down payment.