Neither party gets good marks from its base for handling illegal immigration
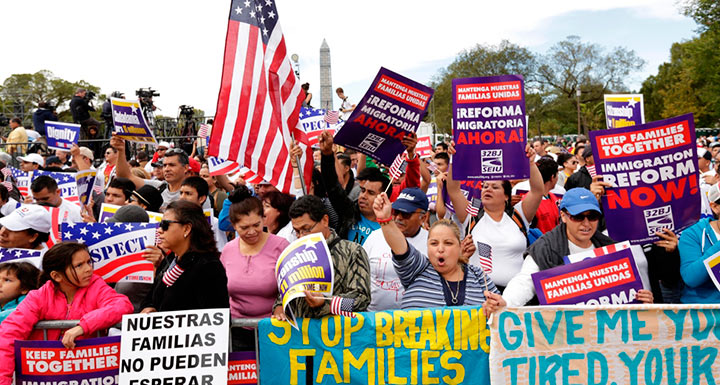
 As the current session of Congress comes to a close without significant action to address illegal immigration, neither Republicans nor Democrats are especially happy with the way their respective parties have dealt with the issue.
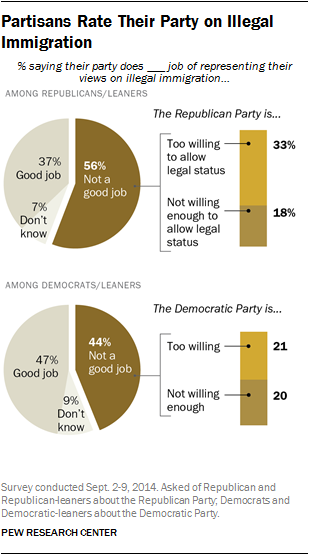
Just 37% of Republicans and Republican leaners think the GOP is doing a good job representing their views on illegal immigration; 56% say they are not doing a good job. Democrats are more positive about their party’s handling of the issue. Still, about as many Democrats and Democratic leaners say the party is not doing a good job (44%) on immigration as say that it is (47%).
Republicans and Democrats who are unhappy with way their party has handled immigration differ in their criticisms. A third of Republicans (33%) say the party has not done a good job on immigration because it is too willing to allow immigrants living in the U.S. illegally to gain legal status; just 18% say it has not done a good job because it is not willing enough to allow immigrants living in the U.S. illegally to gain legal status.
On the Democratic side, as many fault their party for being too willing to allow legal status for people here illegally (21%) as for being too unwilling to allow them legal status (20%).
The new Pew Research Center survey, conducted Sept. 2-9, 2014 among 2,002 adults, including 863 Republicans and Republican leaners, and 913 Democrats and Democratic leaners finds that Republicans are more critical than Democrats of their party’s handling of four major issues: illegal immigration, abortion, government spending and same-sex marriage. (For a look at how religious groups rate their parties, see this report, released Sept. 22 by the Pew Research Center’s Religion & Public Life Project.)
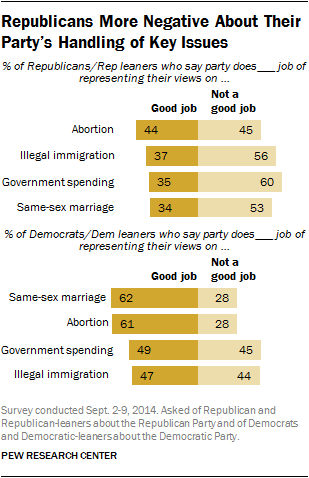 Most Republicans and Republican leaners (60%) say the GOP is not doing a good job of representing their views on government spending. And 53% of Republicans say the party is not doing a good job of representing their views on same-sex marriage. On the issue of abortion, Republicans are divided (44% good job, 45% not a good job).
Democrats have more positive views of the way their party is handling all four issues: About six-in-ten say that the party does a good job of representing their views on same-sex marriage (62%) and abortion (61%). However, only about half of Democrats say their party is doing well on government spending (49%) and immigration (47%).
GOP divisions over party’s approach to Iillegal immigration
Republicans and Democrats who say their party does not do a good job of representing their views on these issues were asked if their party is “too willing” or “not willing enough” allow legal status for those living in the U.S. illegally, cut government spending, restrict abortion and accept same-sex marriage.
Older Republicans and Republican leaners are more critical of the party on illegal immigration and more likely to fault the party for being too willing to allow immigrants living in the U.S. illegally to gain legal status.
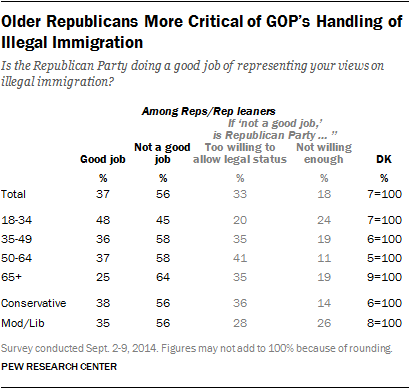 Most Republicans 35 and older (60%) say the party is not doing a good job of representing their views on illegal immigration, compared with 33% who say it is doing a good job. By contrast, Republicans under 35 are divided: 48% say the party is doing a good job and 45% say it is not.
By wide margins, older Republicans who are unhappy with the party’s stance on illegal immigration say it is too willing to allow undocumented immigrants to get legal status. Among those under 35, 20% say it too willing to allow legal status, while about as many (24%) say it is not willing enough.
As many conservative Republicans as moderate and liberal Republicans (56% each) say the party is not doing a job of representing their views on illegal immigration. But by 36% to 14%, conservatives are more likely to fault the GOP for being too willing to allow legal status for undocumented immigrants. Among moderate and liberal Republicans, about as many say the party is “too willing” to allow legal status (28%) as it is “not willing enough” to do.
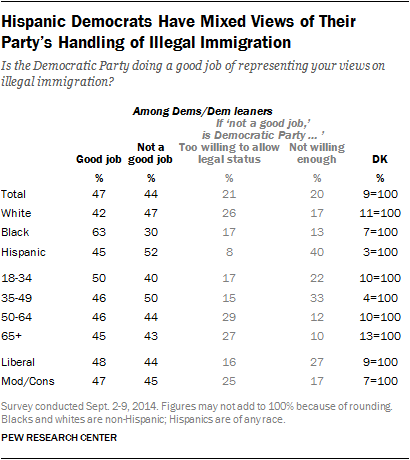 Democrats also are divided over how the party is handling illegal immigration. Black Democrats (63%) are more likely than Hispanic (45%) or white Democrats (42%) to say the party does a good job on illegal immigration.
Hispanic Democrats are much more likely than whites or blacks to criticize the party for not being willing enough to allow legal status for people in the U.S. illegally. Four-in-ten Hispanic Democrats (40%) think the party is not doing a good job on this issue and say it is not willing enough to allow legal status; that compares with just 17% of white Democrats and 13% of black Democrats.
Partisans’ Views of Their Parties on Same-Sex Marriage
About half of Republicans and Republican leaners (53%) say the party is not doing a good job of representing their views on same-sex marriage; 28% are unhappy because the GOP is not willing enough to accept gay marriage, while 22% fault the party for being too willing to accept it.
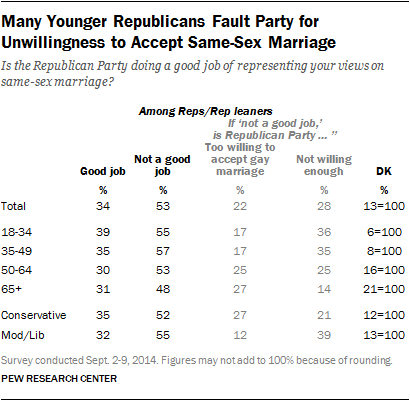 Across all age groups, more Republicans view the party negatively than positively for its handling of same-sex marriage.
However, among younger Republicans more say the party is not willing enough, rather than too willing, to accept same-sex marriage. Among those 18-34, 36% say the party is not doing a good job on gay marriage and criticize it for not being willing enough to accept gay marriage; about half as many (17%) say it is not willing enough. Opinion is similar among Republicans 35 to 49 (35% not willing enough vs. 17% too willing).
Republicans who are 50-64 are divided; equal percentages fault the party for being too willing, and not willing enough, to accept same-sex marriage (25% each). Among those 65 and older, more say it is too willing to accept gay marriage (27% vs. 14%).
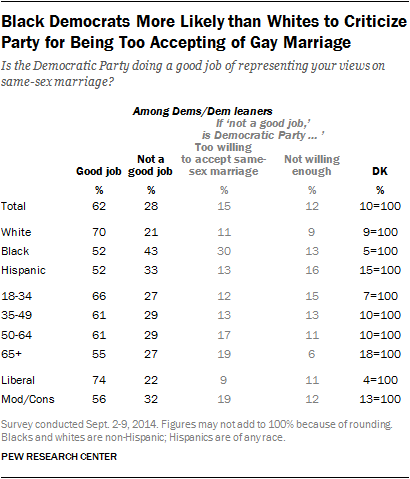 Democrats are divided along racial and ethnic lines over the party’s approach to same-sex marriage. Fully 70% of white Democrats say the party is doing a good job of representing their views on same-sex marriage. The small share of whites who say the party is not doing a good job on this issue are divided over the reason why; 11% say it is because the party is too willing, and 9% not wiling enough, to accept same-sex marriage.
Black Democrats have more negative views of how the party deals with same-sex marriage. Just 52% say it is doing a good job of representing their views. Blacks who criticize the party are far more likely to say it is too willing (30%) than not willing enough (13%) to accept same-sex marriage.
Hispanic Democrats express more negative views of the party’s handling of same-sex marriage (52% good job, 33% not a good job). But about as many Hispanic Democrats say the party is not willing enough to accept gay marriage (16%) as say it is too willing (13%).
 Republicans give party low marks on government spending
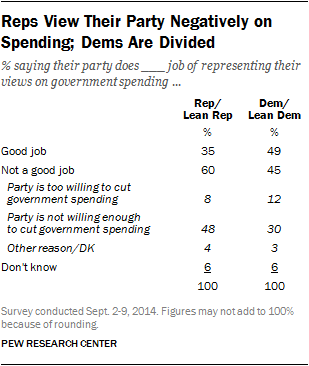
Most Republicans and Republican leaners (60%) say the GOP is not doing a good job representing their views on government spending, and those who express negative views of the party on this issue overwhelmingly criticize it for not being willing enough to cut spending. Nearly half of Republicans (48%) say the party is not doing a good job and say it is not willing enough to cut spending; just 8% criticize the GOP for being too willing to cut spending.
Democrats are divided over their party’s handling of government spending: 49% say the party is doing a good job while 45% say it is not. By 30% to 12%, more Democrats say the party is not willing enough, rather than too willing, to cut government spending.
Democrats More Positive about Party’s Approach to Abortion
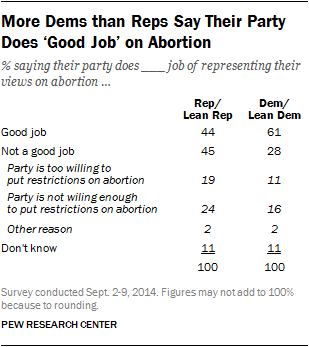 Republican and Republican leaners are divided over their party’s approach to abortion: 44% say it does a good job of representing their views on abortion while 45% disagree.
About a quarter of Republicans (24%) say the party is not doing a good job and say it is not willing enough to put restrictions on abortion; nearly as many (19%) say it is too willing to restrict abortion.
Democrats, by more than two-to-one (61% to 28%), say their party does a good job of representing their views. Roughly equal shares of Democrats say the party is not willing enough (16%), and too willing (11%), to restrict abortion.
About the Survey
The analysis in this report is based on telephone interviews conducted September 2-9, 2014 among a national sample of 2,002 adults, 18 years of age or older, living in all 50 U.S. states and the District of Columbia (801 respondents were interviewed on a landline telephone, and 1,201 were interviewed on a cell phone, including 673 who had no landline telephone). The survey was conducted by interviewers at Princeton Data Source under the direction of Princeton Survey Research Associates International. A combination of landline and cell phone random digit dial samples were used; both samples were provided by Survey Sampling International. Interviews were conducted in English and Spanish. Respondents in the landline sample were selected by randomly asking for the youngest adult male or female who is now at home. Interviews in the cell sample were conducted with the person who answered the phone, if that person was an adult 18 years of age or older. For detailed information about our survey methodology, see http://people-press.org/methodology/
The combined landline and cell phone sample are weighted using an iterative technique that matches gender, age, education, race, Hispanic origin and nativity and region to parameters from the 2012 Census Bureau’s American Community Survey and population density to parameters from the Decennial Census. The sample also is weighted to match current patterns of telephone status (landline only, cell phone only, or both landline and cell phone), based on extrapolations from the 2013 National Health Interview Survey. The weighting procedure also accounts for the fact that respondents with both landline and cell phones have a greater probability of being included in the combined sample and adjusts for household size among respondents with a landline phone. Sampling errors and statistical tests of significance take into account the effect of weighting.
The following table shows the unweighted sample sizes and the error attributable to sampling that would be expected at the 95% level of confidence for different groups in the survey:
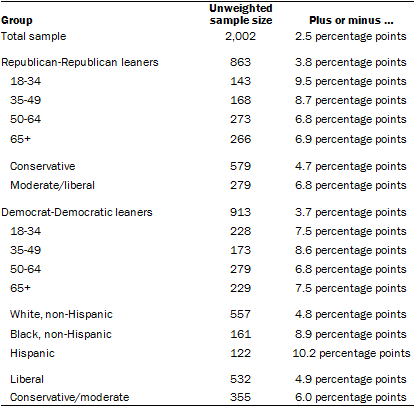 Sample sizes and sampling errors for other subgroups are available upon request. In addition to sampling error, one should bear in mind that question wording and practical difficulties in conducting surveys can introduce error or bias into the findings of opinion polls.
(From the: People Press)